
How does a manufactured object compare to its original CAD design?
Written by: Franck P. Vidal, Iwan T. Mitchell, Jean-Yves Buffière and Jean Michel Létang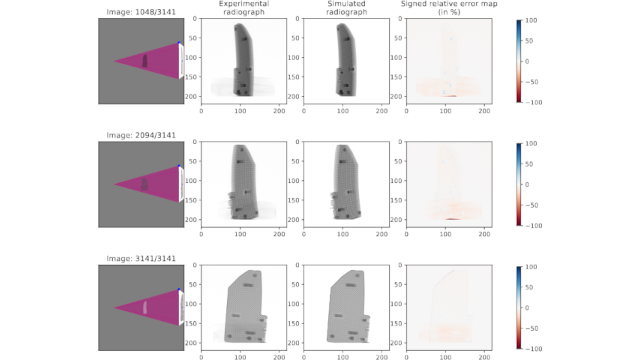 Published on:
 Summary
We investigate methods of assessing how a manufactured part differs from a reference CAD model. We use a part of an in-situ tensile testing machine designed to be used with a scanning electron microscope. CAD drawings are available, and the corresponding 3D surface is exported using the STL file format. After manufacturing, a CT scan was acquired with the DTHE scanner at INSA-Lyon, with 1120 projections, and a final resolution of 400x400x1250 with a voxel size of 0.114 mm3. The challenge faced was how to compare the manufactured part with its original CAD model. Several options were available:
- Manual measurements from the CT volume vs. the CAD drawings;
- CAD model vs. a 3D surface of the manufactured part; and
- CT scan of the manufactured part vs. Simulated CT scan of the CAD model.
The first option is easy to perform, but it is time consuming and prone to manual and procedural errors, and inter-observer variability. For the second option, the surface of the manufactured part must be extracted from the CT data. The volume is segmented using the Otsu’s method with two thresholds to separate air, the holder, and the object. An isosurface is generated from the segmentation using Marching cubes. Geometric measures of the surfaces are computed. For the CAD model, the mesh surface area is 94.70 cm2, and 95.93 cm2 for the manufactured part, with a relative error of 1.29%. The volume is 20.995 cm3 for the CAD model, and 21.574 cm3 for the manufactured part, with a relative error of 2.76%.
The CAD model is registered: a global optimisation algorithm is used with our X-ray simulation software (gVirtualXray) so that simulated projections from the CAD model match the experimental X-ray projections. Using X-ray simulation within the objective function of the registration algorithm allows:
- a direct comparison of the two 3D surfaces using Hausdorff distances, and
- to reconstruct the CT volume of the CAD model.
In turn, making a direct comparison of the experimental CT volume with a CT of the registered CAD model is possible, e.g. using traditional image metrics. Additionally, digital volume correlation (DVC) can be used.
The directed Hausdorff distance computes the shortest distance for every vertex of a 3D surface to a reference 3D surface. The maximum distance using the CAD model as a reference is 4.7 mm. The RMS value is 0.34. A statistical analysis is also performed, generating graphs and an interactive visualisation where the distance magnitude for each surface vertex is displayed as the colour at that location, highlighting that the depths of the screw holes are different, and the thickness of the notch varies on one side.
Due to the approach taken, the two CT volumes are already registered. Our iDVC software is used to generate the displacement vectors with the vertices of the registered CAD model as points of interest. Graphs and displacement vectors are visualised on the volume images or their 2D slices, exhibiting a similar outcome as the previous method.
Publication
Vidal, F. P., Mitchell, I. T., Buffière, J.-Y., & Létang, J. M. (2024 , June). How does a manufactured object compare to its original CAD design? 8th Dimensional X-ray Computed Tomography conference (dXCT MMXXIV). Oral presentation.
Citation
@inproceedings{Vidal2024dXCT,
    title = {How does a manufactured object compare to its original {CAD} design?},
    author = {Franck P. Vidal and Iwan T. Mitchell and
        Jean-Yves Buffi\`ere and Jean Michel L\'etang},
    booktitle = {8th Dimensional X-ray Computed Tomography conference (dXCT MMXXIV)},
    month = jun,
    year = 2024,
}